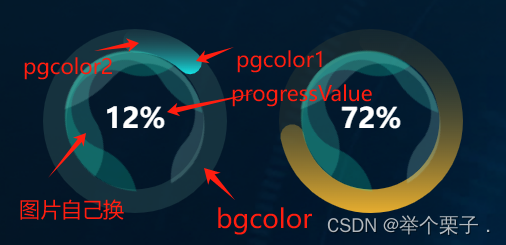
echarts/自定义 环形进度条,源码+图片 复制运行 自取

进度图1:

<!--
 * @FilePath: index.vue
 * @Author: 是十九呐
 * @Date: 2024-06-26 17:56:34
 * @LastEditTime: 2024-06-27 10:16:20
-->
<template>
  <div class="pieChartProgress-container">
    <div class="pieChartProgress-chart" :id="chartId"></div>
    <img class="img" src="@/assets/pieChartProgress/icon_pieChartProgress_greenbg1.png" />
    <img class="img img2" src="@/assets/pieChartProgress/icon_pieChartProgress_greenbg2.png" />
    <img class="img img3" src="@/assets/pieChartProgress/icon_pieChartProgress_greenbg3.png" />
  </div>
</template>

<script>
export default {
  data() {

  },
  props: {
    chartId: {
      type: String,
      default: 'pieChartProgress'
    },
    progressValue: {
      type: Number,
      default: 0
    },
    bgcolor: {
      type: String,
      default: "rgba(50, 90, 92,0.4)"
    },
    pgcolor1: {
      type: String,
      default: "rgba(20, 227, 229, 1)"
    },
    pgcolor2: {
      type: String,
      default: "rgba(50, 90, 92, 0)"
    }
  },
  mounted() {
    this.myEcharts()
  },
  methods: {
    myEcharts() {
      let myChart = this.$echarts.init(document.getElementById(`${this.chartId}`));
      const that = this;

      let option = {
        title: [
          {
            text: `${this.progressValue}%`,
            x: 'center',
            y: 'center',
            textStyle: {
              fontSize: 28,
              color: '#fff',
              fontFamily: 'DINAlternate-Bold, DINAlternate'
            },
          },
        ],
        polar: {
          radius: ['58%', '78%'],
          center: ['50%', '50%'],
        },
        angleAxis: {
          max: 100,
          show: false,
        },
        radiusAxis: {
          type: 'category',
          show: true,
          axisLabel: {
            show: false,
          },
          axisLine: {
            show: false,
          },
          axisTick: {
            show: false,
          },
        },
        series: [
          {
            name: '',
            type: 'bar',
            roundCap: true,
            barWidth: 30,
            showBackground: true,
            backgroundStyle: {
              color: this.bgcolor,
            },
            data: [this.progressValue],
            coordinateSystem: 'polar',
            itemStyle: {
              normal: {
                color: that.$echarts.graphic.LinearGradient(0, 1, 0, 0, [
                  {
                    offset: 0,
                    color: this.pgcolor1,
                  },
                  {
                    offset: 1,
                    color: this.pgcolor2,
                  },
                ]),
              },
            },
          },
        ],
      }
      myChart.setOption(option);
      window.addEventListener('resize', function () {
        myChart.resize();
      });

    }
  }
}
</script>

<style lang="scss" scope>
.pieChartProgress-container {
  width: 100%;
  height: 100%;
  position: relative;

  .pieChartProgress-chart {
    width: 100%;
    height: 100%;
  }

  .img {
    width: 57.6%;
    height: 57.6%;
    opacity: 0.2;
    position: absolute;
    top: 21.4%;
    left: 21.4%;
    animation: rotate 8s linear infinite;
  }

  @keyframes rotate {
    from {
      transform: rotate(0deg);
    }

    to {
      transform: rotate(360deg);
    }
  }

  .img2 {
    animation: rotate-right-to-left 5s linear infinite;
  }

  @keyframes rotate-right-to-left {
    from {
      transform: rotate(0deg);
    }

    to {
      transform: rotate(-360deg);
    }
  }

  .img3 {
    filter: brightness(1.3);
  }
}
</style>

进度图2: 


<template>
  <div class="rotating-circle">
    <div class="circle-img" />
    <div class="circle-img" />
    <div class="circle-img" />
    <div class="circle-text">
      <p class="title">{{ progress }}%</p>
      <p class="desc">进度</p>
    </div>
  </div>
</template>
<script>
export default {
  name: 'rotating-circle',
  props: {
    progress: {
      type: String
    }
  },
  data() {
    return {}
  }
}
</script>
<style lang="scss" scoped>
.rotating-circle {
  width: 100%;
  height: 100%;

  .circle-img {
    width: 180px;
    height: 180px;
    position: absolute;
    background-repeat: no-repeat;
    background-size: 100% 100%;

    &:nth-child(1) {
      z-index: 1;
      background-image: url("~@/assets/economyoperationcontrolplatform/echorw8z5a_1631696624800_jzaj32sdn7.png");
      animation: rotate 5s linear infinite;
    }

    @keyframes rotate {
      from {
        transform: rotate(0deg);
      }

      to {
        transform: rotate(360deg);
      }
    }

    &:nth-child(2) {
      z-index: 2;
      background-image: url("~@/assets/economyoperationcontrolplatform/thl1477aj9_1631696858413_mzuotzvq0i.png");
      animation: rotate-right-to-left 5s linear infinite;
    }

    @keyframes rotate-right-to-left {
      from {
        transform: rotate(0deg);
      }

      to {
        transform: rotate(-360deg);
      }
    }

    &:nth-child(3) {
      z-index: 3;
      background-image: url("~@/assets/economyoperationcontrolplatform/nvtbk6by7m_1631696227177_yy23creoen.png");
      filter: brightness(1.3);
    }
  }

  .circle-text {
    width: 100%;
    height: 100%;
    display: flex;
    flex-wrap: wrap;
    align-content: center;
    text-align: center;

    .title {
      width: 100%;
      font-family: "Title";
      font-size: 25px;
      z-index: 4;
    }

    .desc {
      width: 100%;
      font-size: 14px;
    }
  }
}
</style>

图片素材:


有问题留言...... 

本文来自互联网用户投稿,该文观点仅代表作者本人,不代表本站立场。本站仅提供信息存储空间服务,不拥有所有权,不承担相关法律责任。如若转载,请注明出处:http://www.mfbz.cn/a/752116.html

如若内容造成侵权/违法违规/事实不符,请联系我们进行投诉反馈qq邮箱809451989@qq.com,一经查实,立即删除!

相关文章

【Python机器学习】自动化特征选择——基于模型的特征选择

基于模型的特征选择使用一个监督机器学习模型来判断每个特征的重要性&#xff0c;并且仅保留最重要的特征。用于特征学习的监督模型不需要与用于最终建模的模型相同。特征选择模型需要为每个特征提供某种重要性度量&#xff0c;以便用这个度量对特征进行排序。决策树和基于决策…

3D立体卡片动效(附源码)

3D立体卡片动效 欢迎关注&#xff1a;xssy5431 小拾岁月参考链接&#xff1a;https://mp.weixin.qq.com/s/9xEjPAA38pRiIampxjXNKQ 效果展示 思路分析 需求含有立体这种关键词&#xff0c;我们第一反应是采用动画中的平移、倾斜等实现。如果是立体&#xff0c;必然产生阴影&…

哈喽GPT-4o,对GPT-4o 数据分析Data Analysis的思考与看法

目录 上传一个Excel给Data Analysis。Prompt&#xff1a;请问这个数据集是做什么的Prompt&#xff1a;请问书籍的定价如何&#xff0c;请用合适的图表展示它的售价情况Prompt&#xff1a;请统计书名列中出现最多的名称&#xff0c;然后使用词云将其可视化。Prompt&#xff1a;请…

FastGPT部署和OneAPI部署

FastGPT模型管理 FastGPT只支持openai 格式的restful 的api接口。 就是 chat/completion那个接口。如果不理解可以参考这个文章 https://zhuanlan.zhihu.com/p/656959227 。 支持Python 。JAVA 等后端语言或者 http 访问 因此如果想访问大模型&#xff0c;有以下几种方案&…

软件需求管理规程(DOC原件)

软件需求管理规程是确保软件开发过程中需求清晰、一致、可追踪的关键环节&#xff1a; 明确需求&#xff1a;项目初期&#xff0c;与利益相关者明确项目目标和需求&#xff0c;确保需求完整、无歧义。需求评审&#xff1a;组织专家团队对需求进行评审&#xff0c;识别潜在风险和…

C++ 矩阵的最小路径和解法

描述 给定一个 n * m 的矩阵 a,从左上角开始每次只能向右或者向下走,最后到达右下角的位置,路径上所有的数字累加起来就是路径和,输出所有的路径中最小的路径和。 数据范围: 1≤𝑛,𝑚≤5001≤n,m≤500,矩阵中任意值都满足 0≤𝑎𝑖,𝑗≤1000≤ai,j​≤100 要求…

Google Earth Engine(GEE)——ui.Label如何添加链接和使用

结果 这个Google的连接可以直接点开 函数: ui.Button(label, onClick, disabled, style) A clickable button with a text label. Arguments: label (String, optional): The buttons label. Defaults to an empty string. onClick (Function, optional): A callbac…

SNAT和DNAT的原理和应用

SNAT和DNAT的原理和应用 一、SNAT&#xff08;源网络地址转换&#xff09; 原理&#xff1a; SNAT&#xff08;Source Network Address Translation&#xff09;是将私有网络内部主机的源IP地址转换为公共IP地址&#xff0c;用于在内部网络中的主机访问外部网络时隐藏内部IP…

隐语课程学习笔记12 - 基于隐语的VisionTransformer框架

主讲老师&#xff1a;曾文轩 学习链接&#xff1a;第12讲&#xff1a;基于隐语的Vision Transformer框架 论文&#xff1a;【ICCV2023】MPCViT: Searching for Accurate and Efficient MPC-Friendly Vision Transformer with Heterogeneous Attention 隐语课程第12课&#xff…

项目测试计划(Word)

1简介 1.1 目的 1.2 范围 2. 测试参考文档和测试提交文档 2.1 测试参考文档 2.2 测试提交文档 3. 测试策略 3.1整体测试策略 3.2功能测试 3.3 界面测试 3.4 性能测试 3.5 安全性测试 3.6 工具 4 测试阶段进入和退出标准 4.1进入标准 4.2退出标准 5 测试范围 5.1需要测试的模块 …

2024/6/28 英语每日一段

The Supreme Court on Thursday rejected a challenge to an obscure provision of President Donald Trump’s 2017 tax package, ending a lawsuit that many experts feared could destabilize the nation’s tax system. In a divided decision, the court upheld a one-ti…

uboot基本使用网络命令和从服务器端下载linux内核启动

网络命令ip地址设置: setenv gmac_debug 0; setenv mdio_intf rgmii; setenv bootdelay 1; setenv ethaddr 00:xxxx:81:70; // mac地址 setenv ipaddr xxx; //开发板 IP 地址 setenv netmask 255.255.255.0; setenv gatewayip xxx.1; setenv serverip xxxx; //服…

如何在LabVIEW中使用FPGA模块

LabVIEW FPGA模块是NI公司推出的一款强大工具&#xff0c;它允许用户使用LabVIEW图形化编程环境来开发FPGA&#xff08;现场可编程门阵列&#xff09;应用程序。与传统的HDL&#xff08;硬件描述语言&#xff09;编程相比&#xff0c;LabVIEW FPGA模块大大简化了FPGA开发的过程…

Ollama qwen2:7b

简介 一个简明易用的本地大模型运行框架&#xff0c;Ollama官网&#xff1a;Ollama ollama命令 ollama有类似docker的命令。下面是一些模型(large language models)的操作命令: ollama list&#xff1a;显示模型列表ollama show&#xff1a;显示模型的信息ollama pull&#…

kafka-高可用设计详解(集群架构、备份机制、消费者组、重平衡)

文章目录 kafka高可用设计集群架构Kafka集群选举ISR与OSRLEO和HWKafka分区Leader选举Leader Replica选举策略Leader Replica选举过程 副本机制(Replication&#xff09;消费者组和再均衡消费者组再均衡(重平衡) 更多相关内容可查看 kafka高可用设计 Apache Kafka 的高可用设计…

第24篇 滑动开关控制LED<二>

Q&#xff1a;如何使用Intel FPGA Monitor Program创建滑动开关控制LED工程并运行呢&#xff1f; A&#xff1a;创建工程的基本过程与前面的Intel FPGA Monitor Program的使用<三>一样&#xff0c;不同的地方是&#xff0c;本实验工程用到了开发板的外设硬件LED和SW&…

[JS]节点操作

DOM节点 DOM树中的所有内容都是节点, 我们重点关注元素节点 作用 使开发者可以根据节点的关系获取元素, 而不是只能依赖选择器, 提高了编码的灵活性 节点分类 元素节点: 所有的标签都是元素节点, html是根节点属性节点: 所有的属性都是属性节点, 比如href文本节点: 所有的文…

Qt6.6编译Qt二维图形编辑器QVGE源码

QVGE是一个开源的多平台QtC编写的图形编辑器&#xff0c;可以用来画网络节点图&#xff0c;或者其他作用。 QVGE可以轻松创建和参数设定的小型到中型图形(1000节点/边缘)&#xff0c;共同的视觉特性的节点和边缘&#xff1a;形状、尺寸、颜色、标签等。定义(用户定义)属性的图表…

【异常总结】SeaTunnel集群脑裂配置优化方法

集群配置 项目描述数量3台规格阿里云ECS 16C64GSlot模式静态50个ST内存配置-Xms32g -Xmx32g -XX:MaxMetaspaceSize8g 异常问题 4月份以来&#xff0c;出现了3次集群脑裂现象&#xff0c;均为某节点脑裂/自动关闭。 核心日志如下&#xff1a; Master节点 出现Hazelcast监控…

开源大模型RAG企业本地知识库问答机器人-ChatWiki

ChatWiki ChatWiki是一款开源的知识库 AI 问答系统。系统基于大语言模型&#xff08;LLM &#xff09;和检索增强生成&#xff08;RAG&#xff09;技术构建&#xff0c;提供开箱即用的数据处理、模型调用等能力&#xff0c;可以帮助企业快速搭建自己的知识库 AI 问答系统。 开…